
Permanent Tide Gauges
The Norwegian Mapping Authority has several permanent tide gauges along the Norwegian coast and one in Svalbard. Some of these have observations going back to the beginning of the 20th century.
The permanent tide gauges measure the water level continuously, and the observations are available in the web-service Se havnivå in near real time.
Among other things, water level measurements are used to study long-term sea level changes, and to calculate future sea levels. The water level measurements are also used to calculate the astronomical tide and provide tide tables along the Norwegian coast.
The measurements are also included in the Norwegian Meteorological Institute's models for surge, which in turn are used to calculate a water level forecast five days in advance and to issue natural hazard alerts.
The permanent tide gauges are located along the Norwegian coast in addition to one in Ny-Ålesund on Svalbard.
Available data
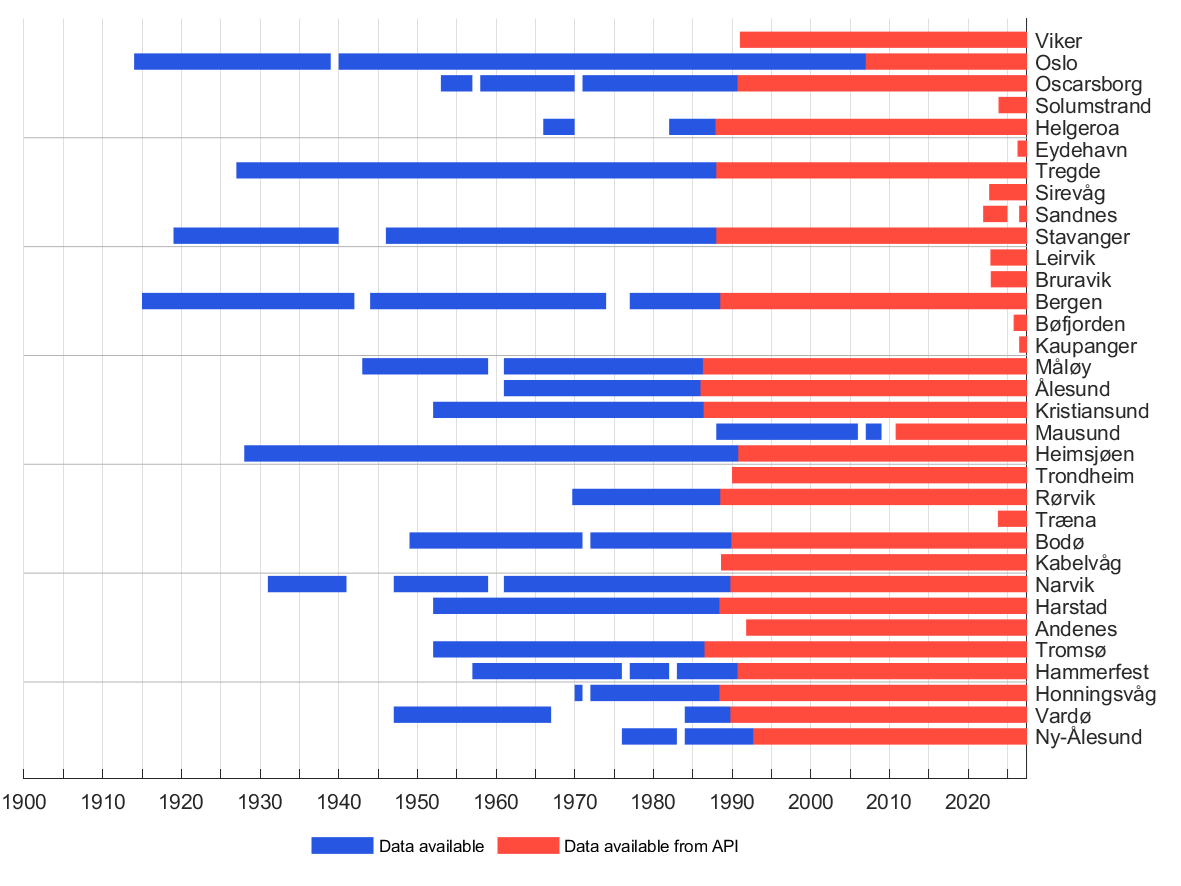
If you are interested in downloading data from the Norwegian Mapping Authority's permanent tide gauges, the figure below provides an overview of the available data.
NB: Newly established tide gauges do not have data available until these have been quality-controlled.
Observations from the tide gauges that aren’t available via the web-service Se havnivå or the API for water level data, can be downloaded via the Copernicus Marine Service.
Monthly and annual averages are in most cases available online for the entire period.
Permanent tide gauges shown in a map
Additional Water Level Data
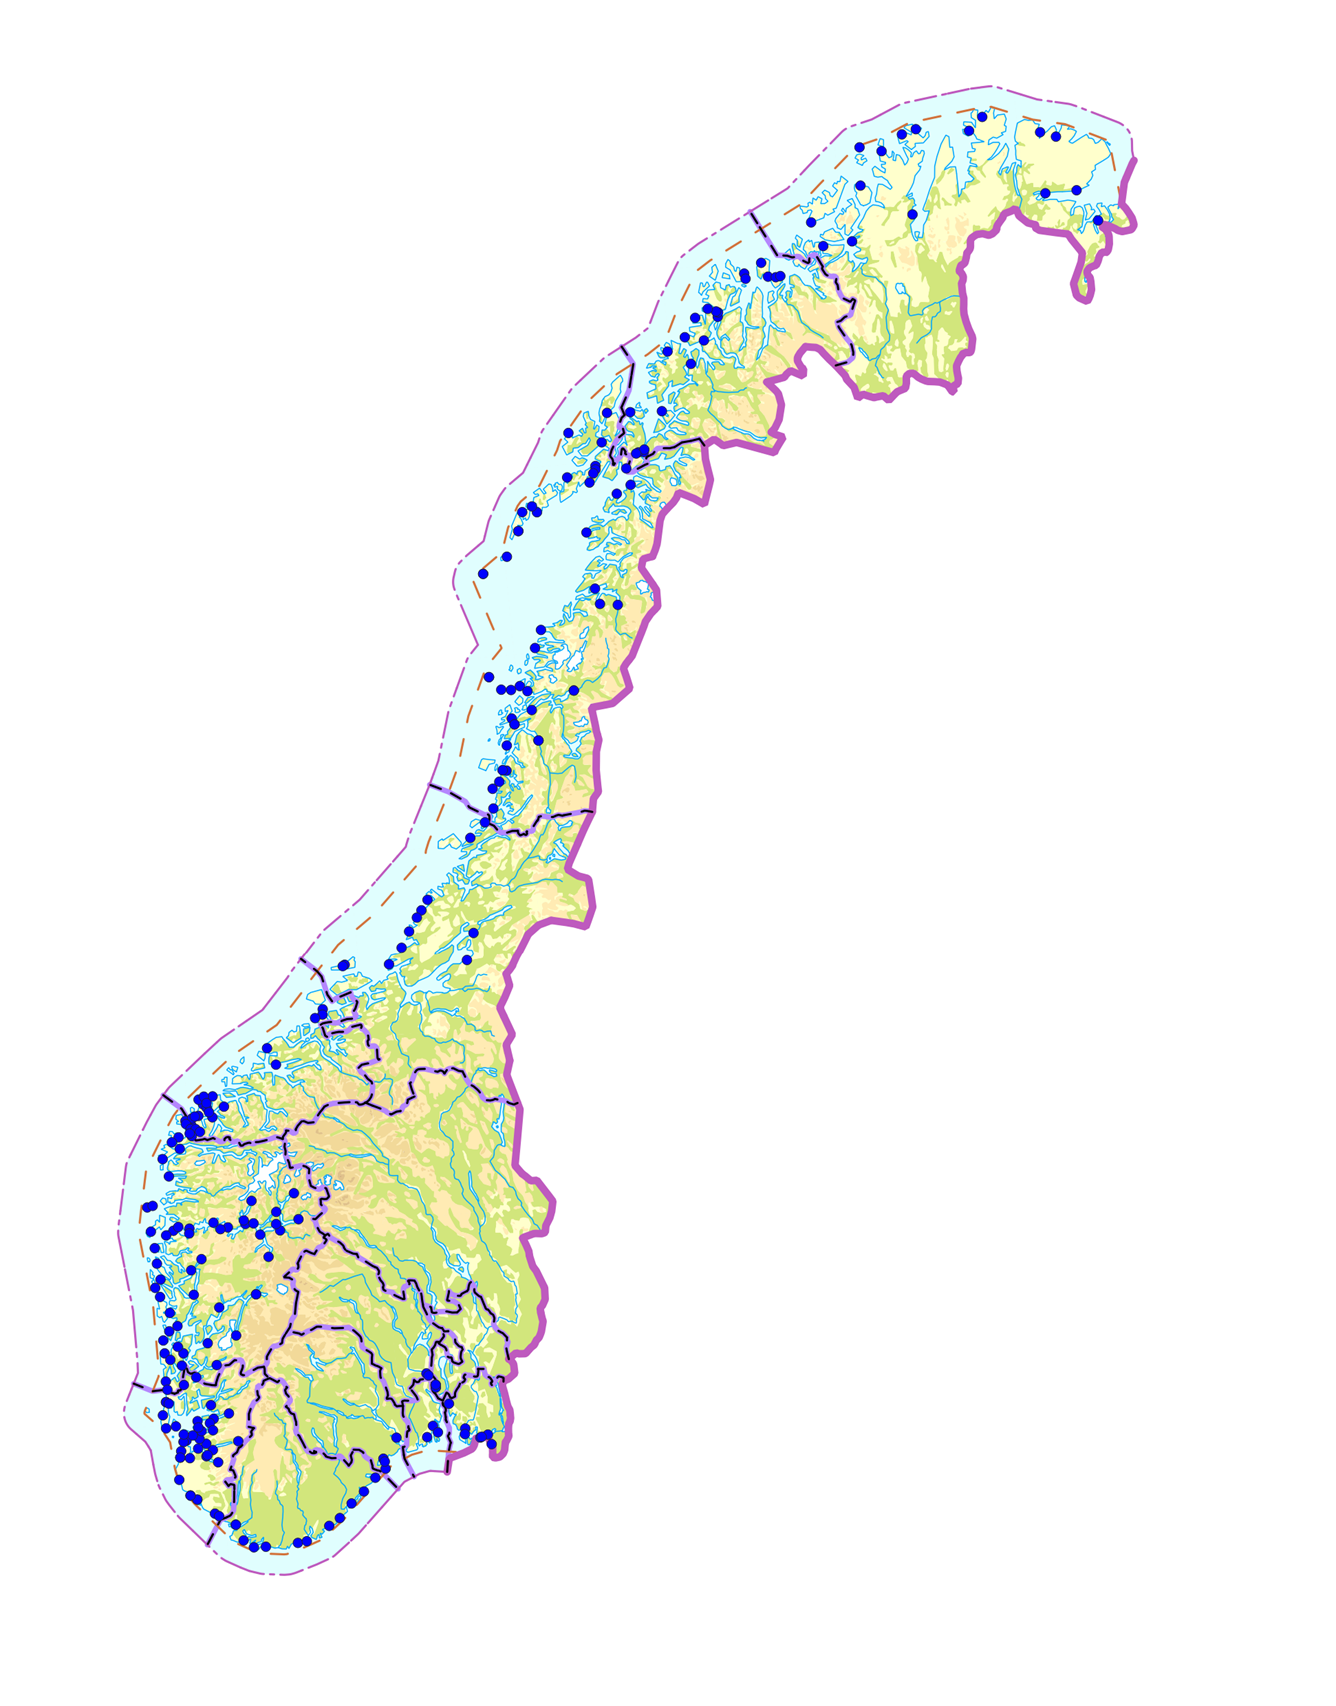
In addition to the permanent gauges, the Norwegian Mapping Authority has collected a number of shorter time series of water level. These typically span a few months, though in some cases they extend to around two years.
The map below shows most of the locations where water level has been recorded over the past 20 years. The Norwegian Mapping Authority is working to make these datasets available in the same way as data from the permanent tide gauges.
Se havnivå Water Level and Tides
Se havnivå provides information about water level, tides, vertical datums, land uplift and future sea level projections for the Norwegian coast:
The mail has been sent!